
Measuring productivity through Overall Equipment Effectiveness (OEE)
Productivity can mean different things to different people. It is a ratio of two numbers output divided by input during a time period. Sometimes engineers talk about efficiency and a manufacturing engineer in a metal working industry will talk about the efficiency of his machine, assembly line or plant. He may well say that his machine efficiency is 85%. What does this mean? Does it mean that his machine works for 85% of the time or does it mean that 85% of the parts produced are correct or that the machine is producing at the rate of 85% of when it was new? Thus efficiency figures are not very clear unless one understands the basis of calculating it. One needs a productivity measuring system with a common basis to be more meaningful as well as amenable for analysis.
The cycle time of a component is 6 min/part one expects 70 parts in 7 hours (one shift). Do we actually get 70 good parts in every shift? This question if asked to most production engineer, the answer is no and the number maybe anywhere between 50 and 70. Why is this so? The reasons are many, and can be classified under three heads.
- Availability
- Performance
- Quality
Availability or Availability Efficiency (Ae) is defined as to what extent is asset (machine, equipment) available for production.
Performance or Performance Efficiency (Pe ) is defined as to what extent is asset performance compared to rated performance.
Quality or Quality Efficiency (Qe) is defined as to what extent quality is produced as compared to rated quality.
Please note the words rated in italics in the definitions to which we will return a little later.
Availability
The formula for calculating Availability (Ae) is Available Time/ Loading Time where Available Time is (Loading Time – Down Time). Here Loading Time is the time in a day/ shift after accounting for breaks granted by the management, for example, lunch and tea breaks or personal time. Illustrating this with an example, in a day of 24 hours, if 30 min is provided for lunch/ dinner break and two tea breaks of 15 min each in each shift, the Loading Time would be 24 – 1.5 (lunch breaks in 3 shifts) – 1.5 (tea breaks in 3 shifts) would be 21 hrs. Now during the day there is a set up change of 60 min and maintenance of 30 min, then the Down Time is 1.5 hrs and the Availability (Ae) is (21-1.5)/21 = 92.85% or 93%
Down Time could be due to many reasons including set up change time, breakdown maintenance time, preventive maintenance time, chip removal time, coolant change time, tool change time, time lost due to no power or no tool or no operator or no work, time lost as machine is stopped for inspection or process problem or fixture problem, time lost due to new part development and so on. All time lost due to machine stoppage exceeding 10 min is captured under Down Time and affects Ae.
If in any company Ae is below 90%, one can drill down various Down Times, carry out a Pareto Analysis and determine which ones contribute to 80% of Down Time and then work to reduce them. For example if Set up time is a major contributor, one can use SMED principles to reduce it. If breakdown maintenance is a key contributor then autonomous maintenance is an approach to reduce it. Thus an action plan can be prepared to attack the Down Time after a thorough Why Why analysis.
Performance
The formula for Performance Efficiency (Pe) is (Parts produced * Actual cycle time)/ Available Time. Referring to our earlier example, against the expected 70 parts only 65 parts were actually produced in the 7 hr shift. Let us assume that there was no Down Time in this shift. In this case the cycle time is 6 min per part and the Pe would be 65*6/420 = 92.85% or 93%.
To analyse Performance Efficiency better it can be broken down further into two factors i.e. idle or minor loss and speed loss. Speed loss is the ratio of rated cycle time/actual cycle time. It is a measure to determine to what extent a process has deteriorated from its rated condition or ideal condition. The ideal condition is when everything is ideal, i.e. machine is new, raw material has the correct composition and machining allowance, cutting tools are sharp, operators are skilled in using the machine and well trained, and process is optimized. Production is lost if these ideal condition is lost. Even if the rated cycle time is maintained there are minor stoppages for example, an insert has to be indexed, a tool offset has to be given, a chip has to be removed during part loading, etc. Each of these stoppages are below 10 min and are not accounted in Ae but in Pe. Idle or minor loss formula is Parts produced*rated cycle time/ Available Time. Pe can now be rewritten as Pe = Idle loss*speed loss = (Parts produced*rated cycle time/ Available Time)*(rated cycle time/actual cycle time)
Performance is reduced for various reasons leading to less parts produced due to frequent change in process, long inspection time during which machine is idling, cleaning time, fetching tools or fixtures or material from another location, unoptimised part clamping/ unclamping time, inconsistent incoming material, variable manual operation time, low cutting parameters due to wear and tear of machine and many more reasons. The lost time is less than 10 min for each occurrence else it would be accounted in Ae. If Pe, Speed Loss and idle or minor loss is found less than 90%. one can drill down various losses, carry out a Pareto Analysis and determine which ones contribute to 80% and then work to reduce them.
Quality
The formula for Quality Efficiency (Qe) is (total parts produced – non confirming parts)/ total parts produced. Continuing with the earlier illustration if 3 parts were non confirming i.e. including scrap and rework, then the Qe = (65-3)/ 65 = 95.38% or 95%
The most important reasons for a low Qe would be lack of process capability. This leads to scrap as well as rework. Often this is a result of lack of control of inputs such as material, tools, fixtures, machine and process. Poor maintenance of machine can also lead to a lower Qe.
The Overall Equipment Effectiveness or OEE is a product of the three factors: Ae * Pe * Qe. In our example it would be 93%*93%*95% = 82%. This clearly shows that when manufacturing engineers talk about efficiency and quote figures of 85 to 90% in reality they may not be achieving it as it could be Ae or Pe or Qe alone and not the product.
One must have noted that both in Pe and Qe, we are considering the rated or ideal condition, i.e. the rated cycle time and rated conformance in quality (100% conformance to quality standards).
For an owner of a company, there is cost of money. This is the interest paid to a bank or financial institution on borrowing money, or the interest a promoter would earn if he were to invest his capital somewhere else. In either case interest is calculated on the basis of 365 days*24 hours. Therefore OEE should ideally be calculated on the same basis, i.e. 365 days*24 hours. In our example we calculated Loading Time as 24hrs less breaks allowed by management and arrived at 21 hrs. If one were not to do so and take 24 hrs itself as Loading Time, one would get a more correct picture of utilizing ones equipment effectively. The loss of 3 hrs is a Management Loss because management is unable to utilize the equipment during breaks. This is captured by a metric Me.
Total Effective Equipment Performance (TEEP) which is a product of Me*Ae*Pe*Qe. In this case Me is Loading Time/ 24hrs. In our example it would have been 21/24 = 87%. Now if OEE was 82% the TEEP would be 87%*82% = 71%. This shows that there is a potential capacity to improve productivity by as much as 29%.
The National Productivity Summit 2015 at Gurgaon on 20 -21st Nov, showcases through its case studies and keynote addresses how teams have significantly improved productivity at their workplace. Various tools have been effectively used by these teams to discover the hidden losses in their process and they have found innovative solutions to their challenges thrown to them by their customers. This “out of the box” thinking is very important for these companies to continue to be competitive. Participants attending this summit can take away lessons and get motivated to emulate the award winners in their own companies.
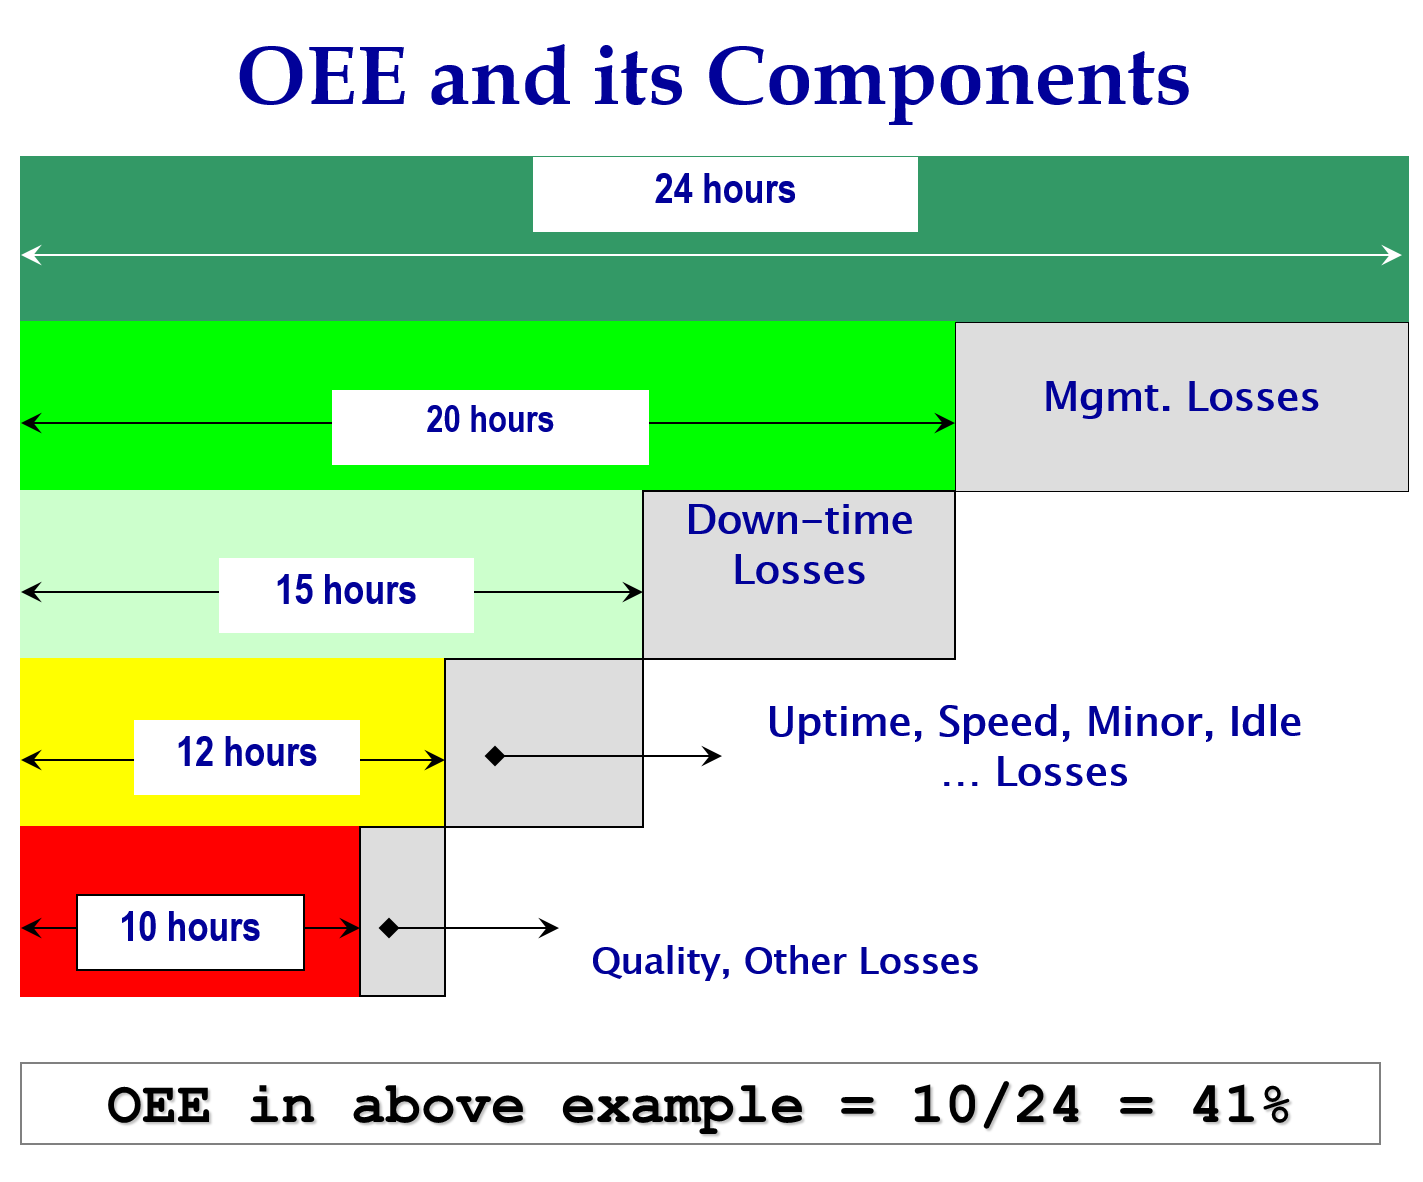
This figure shows a TEEP of 41%, which is typical of many companies who start measuring OEE